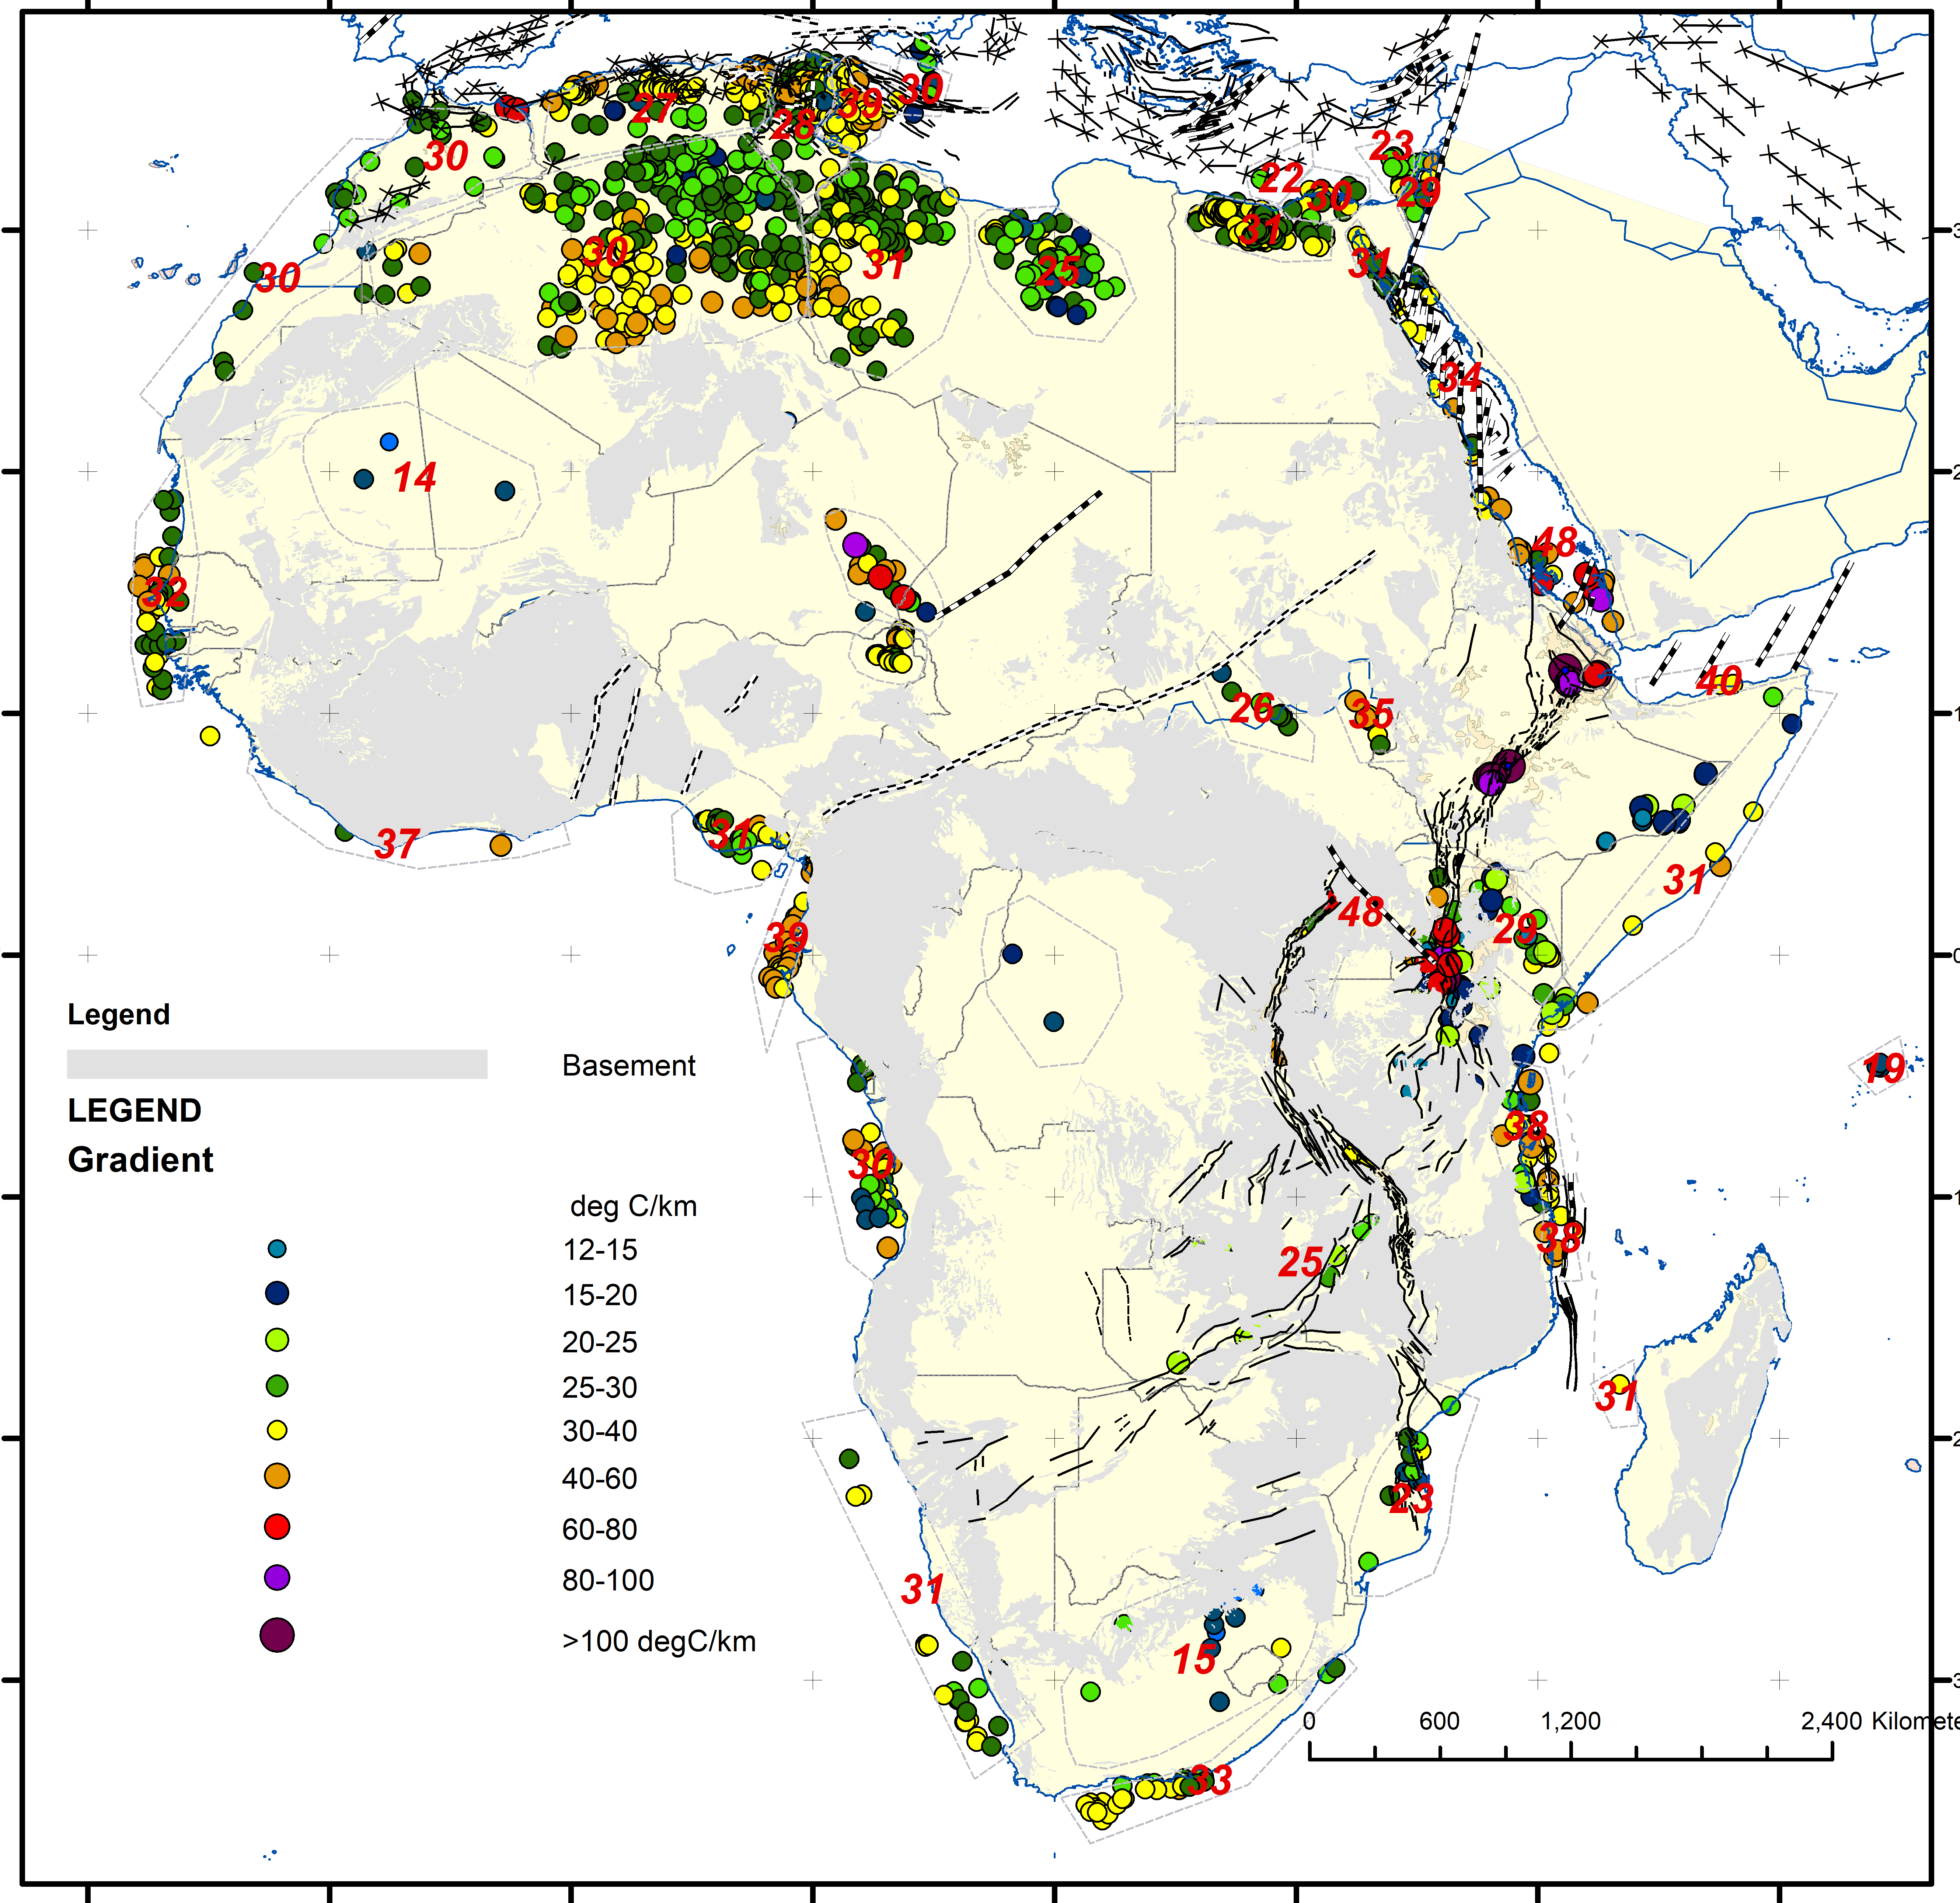
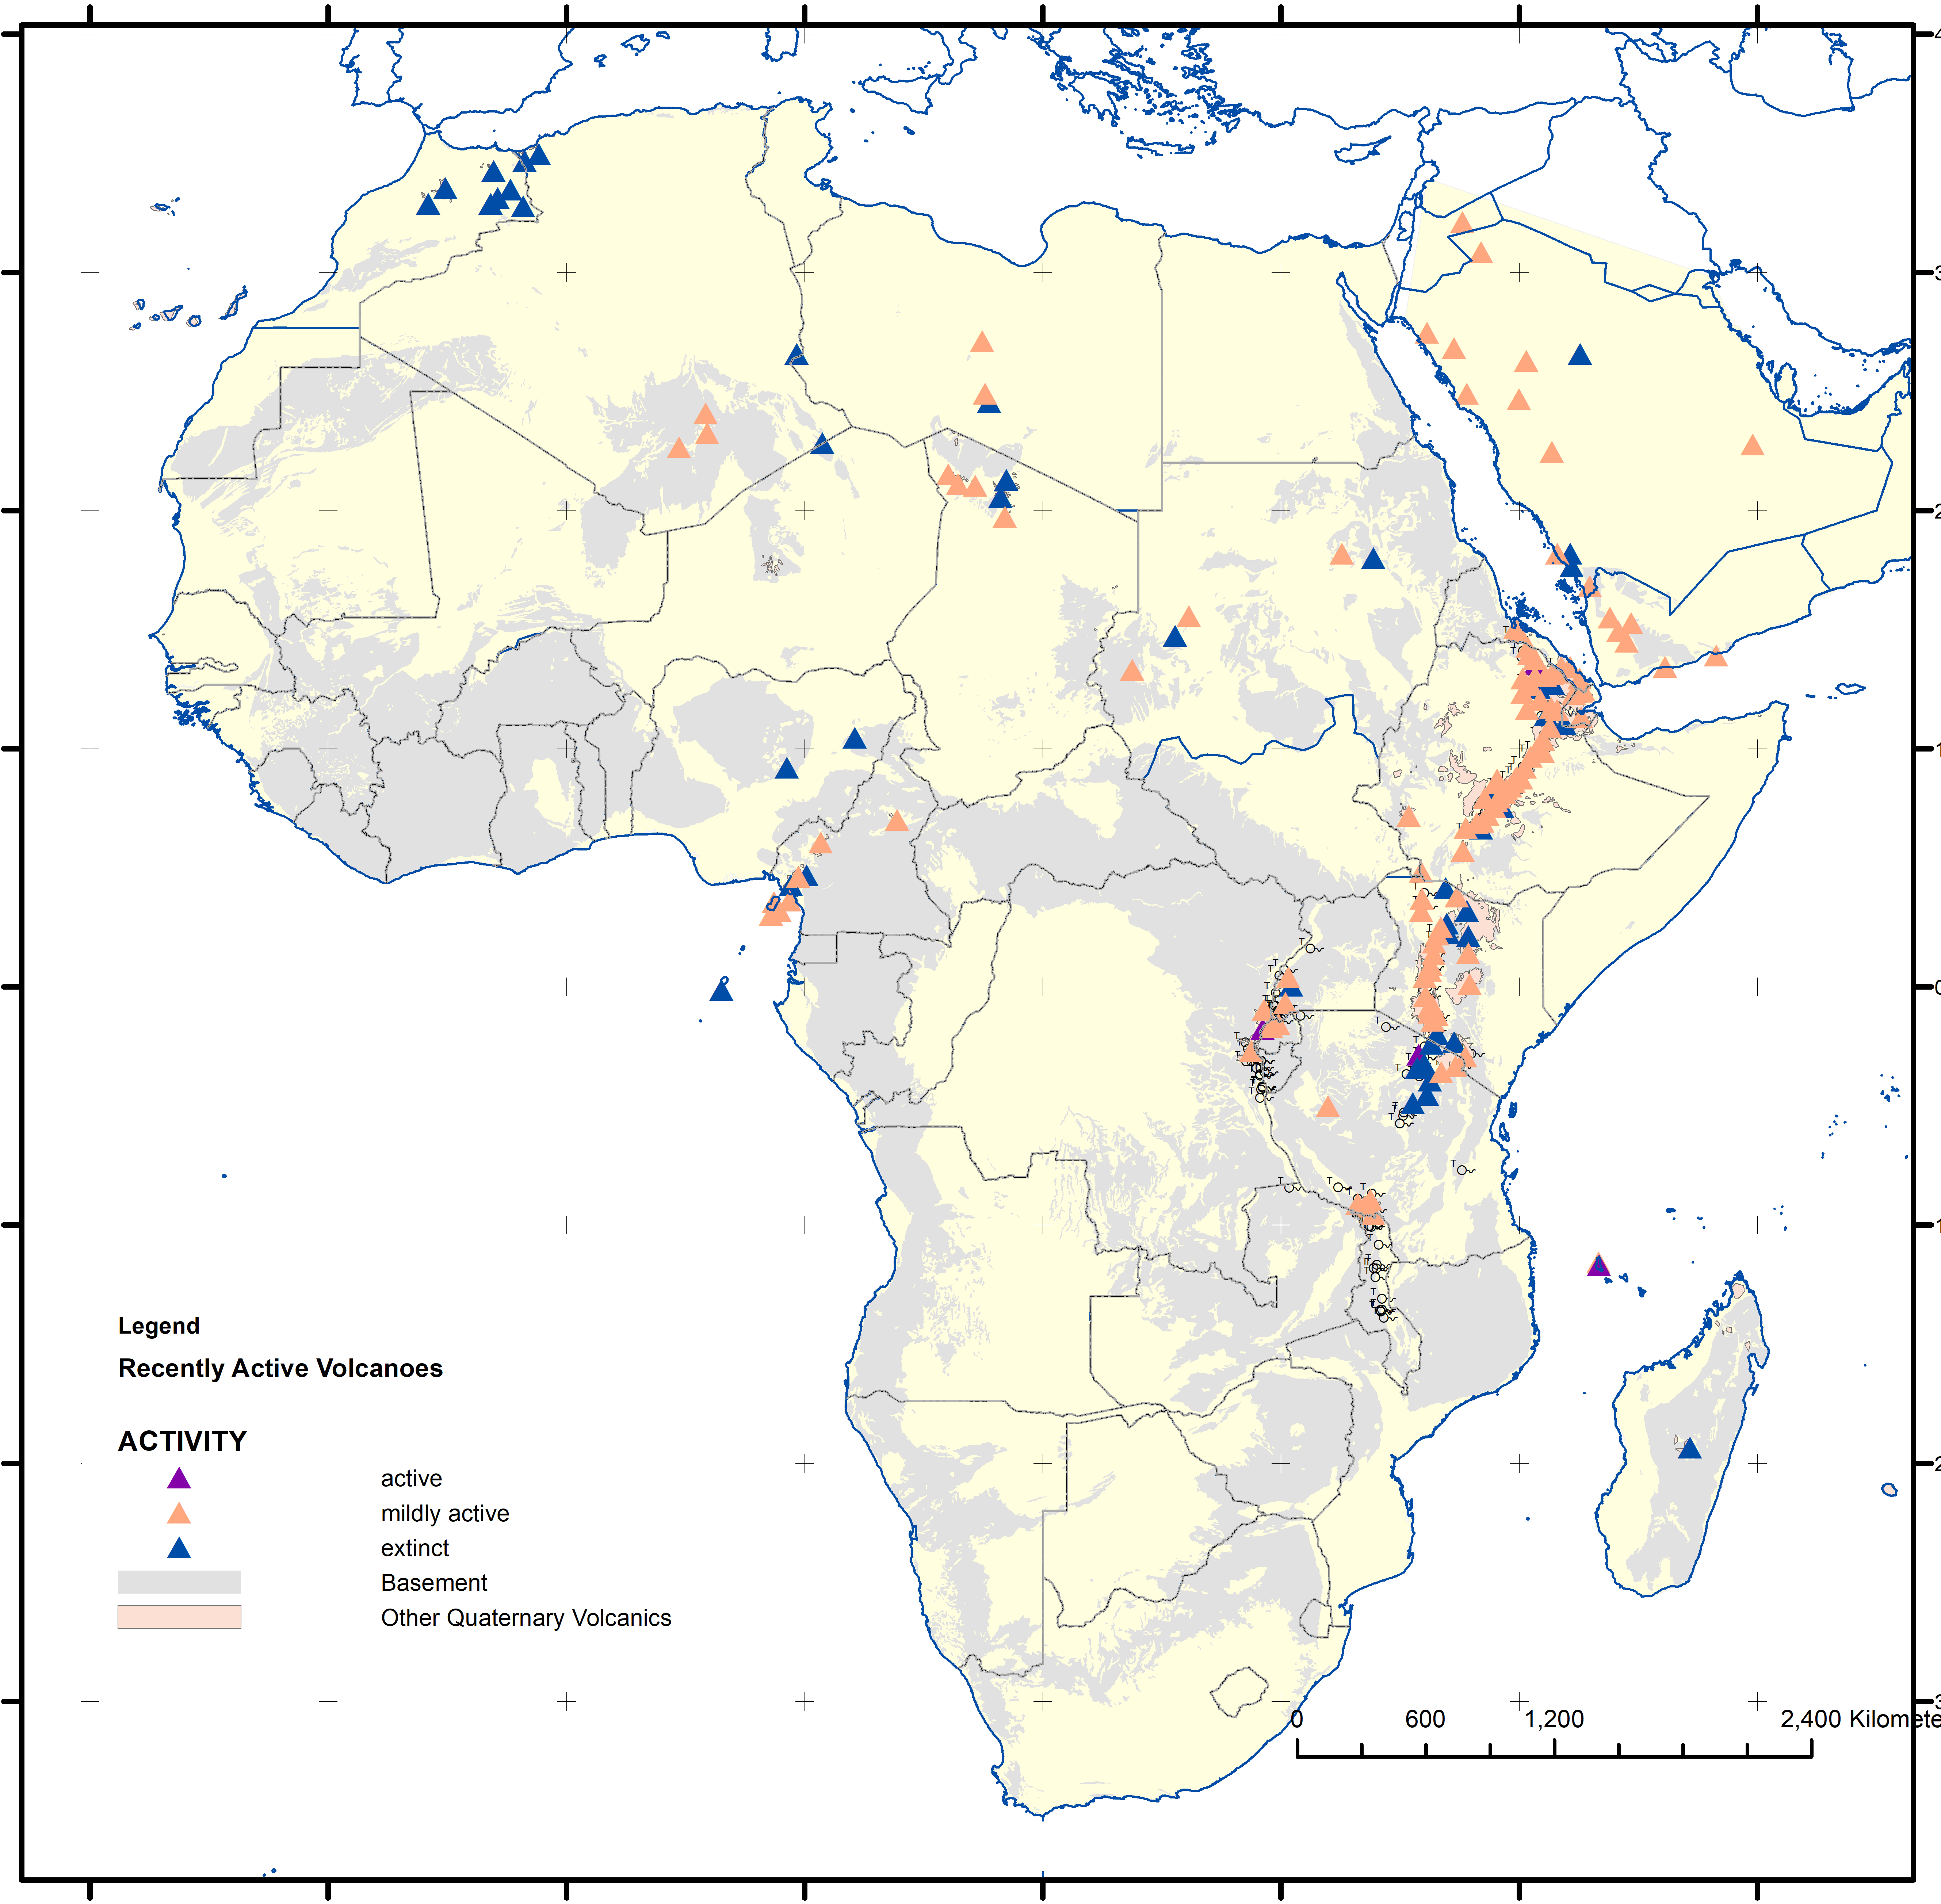
Comparative Geothermal Gradients and Heat Flows across African Basins derived from deep wells
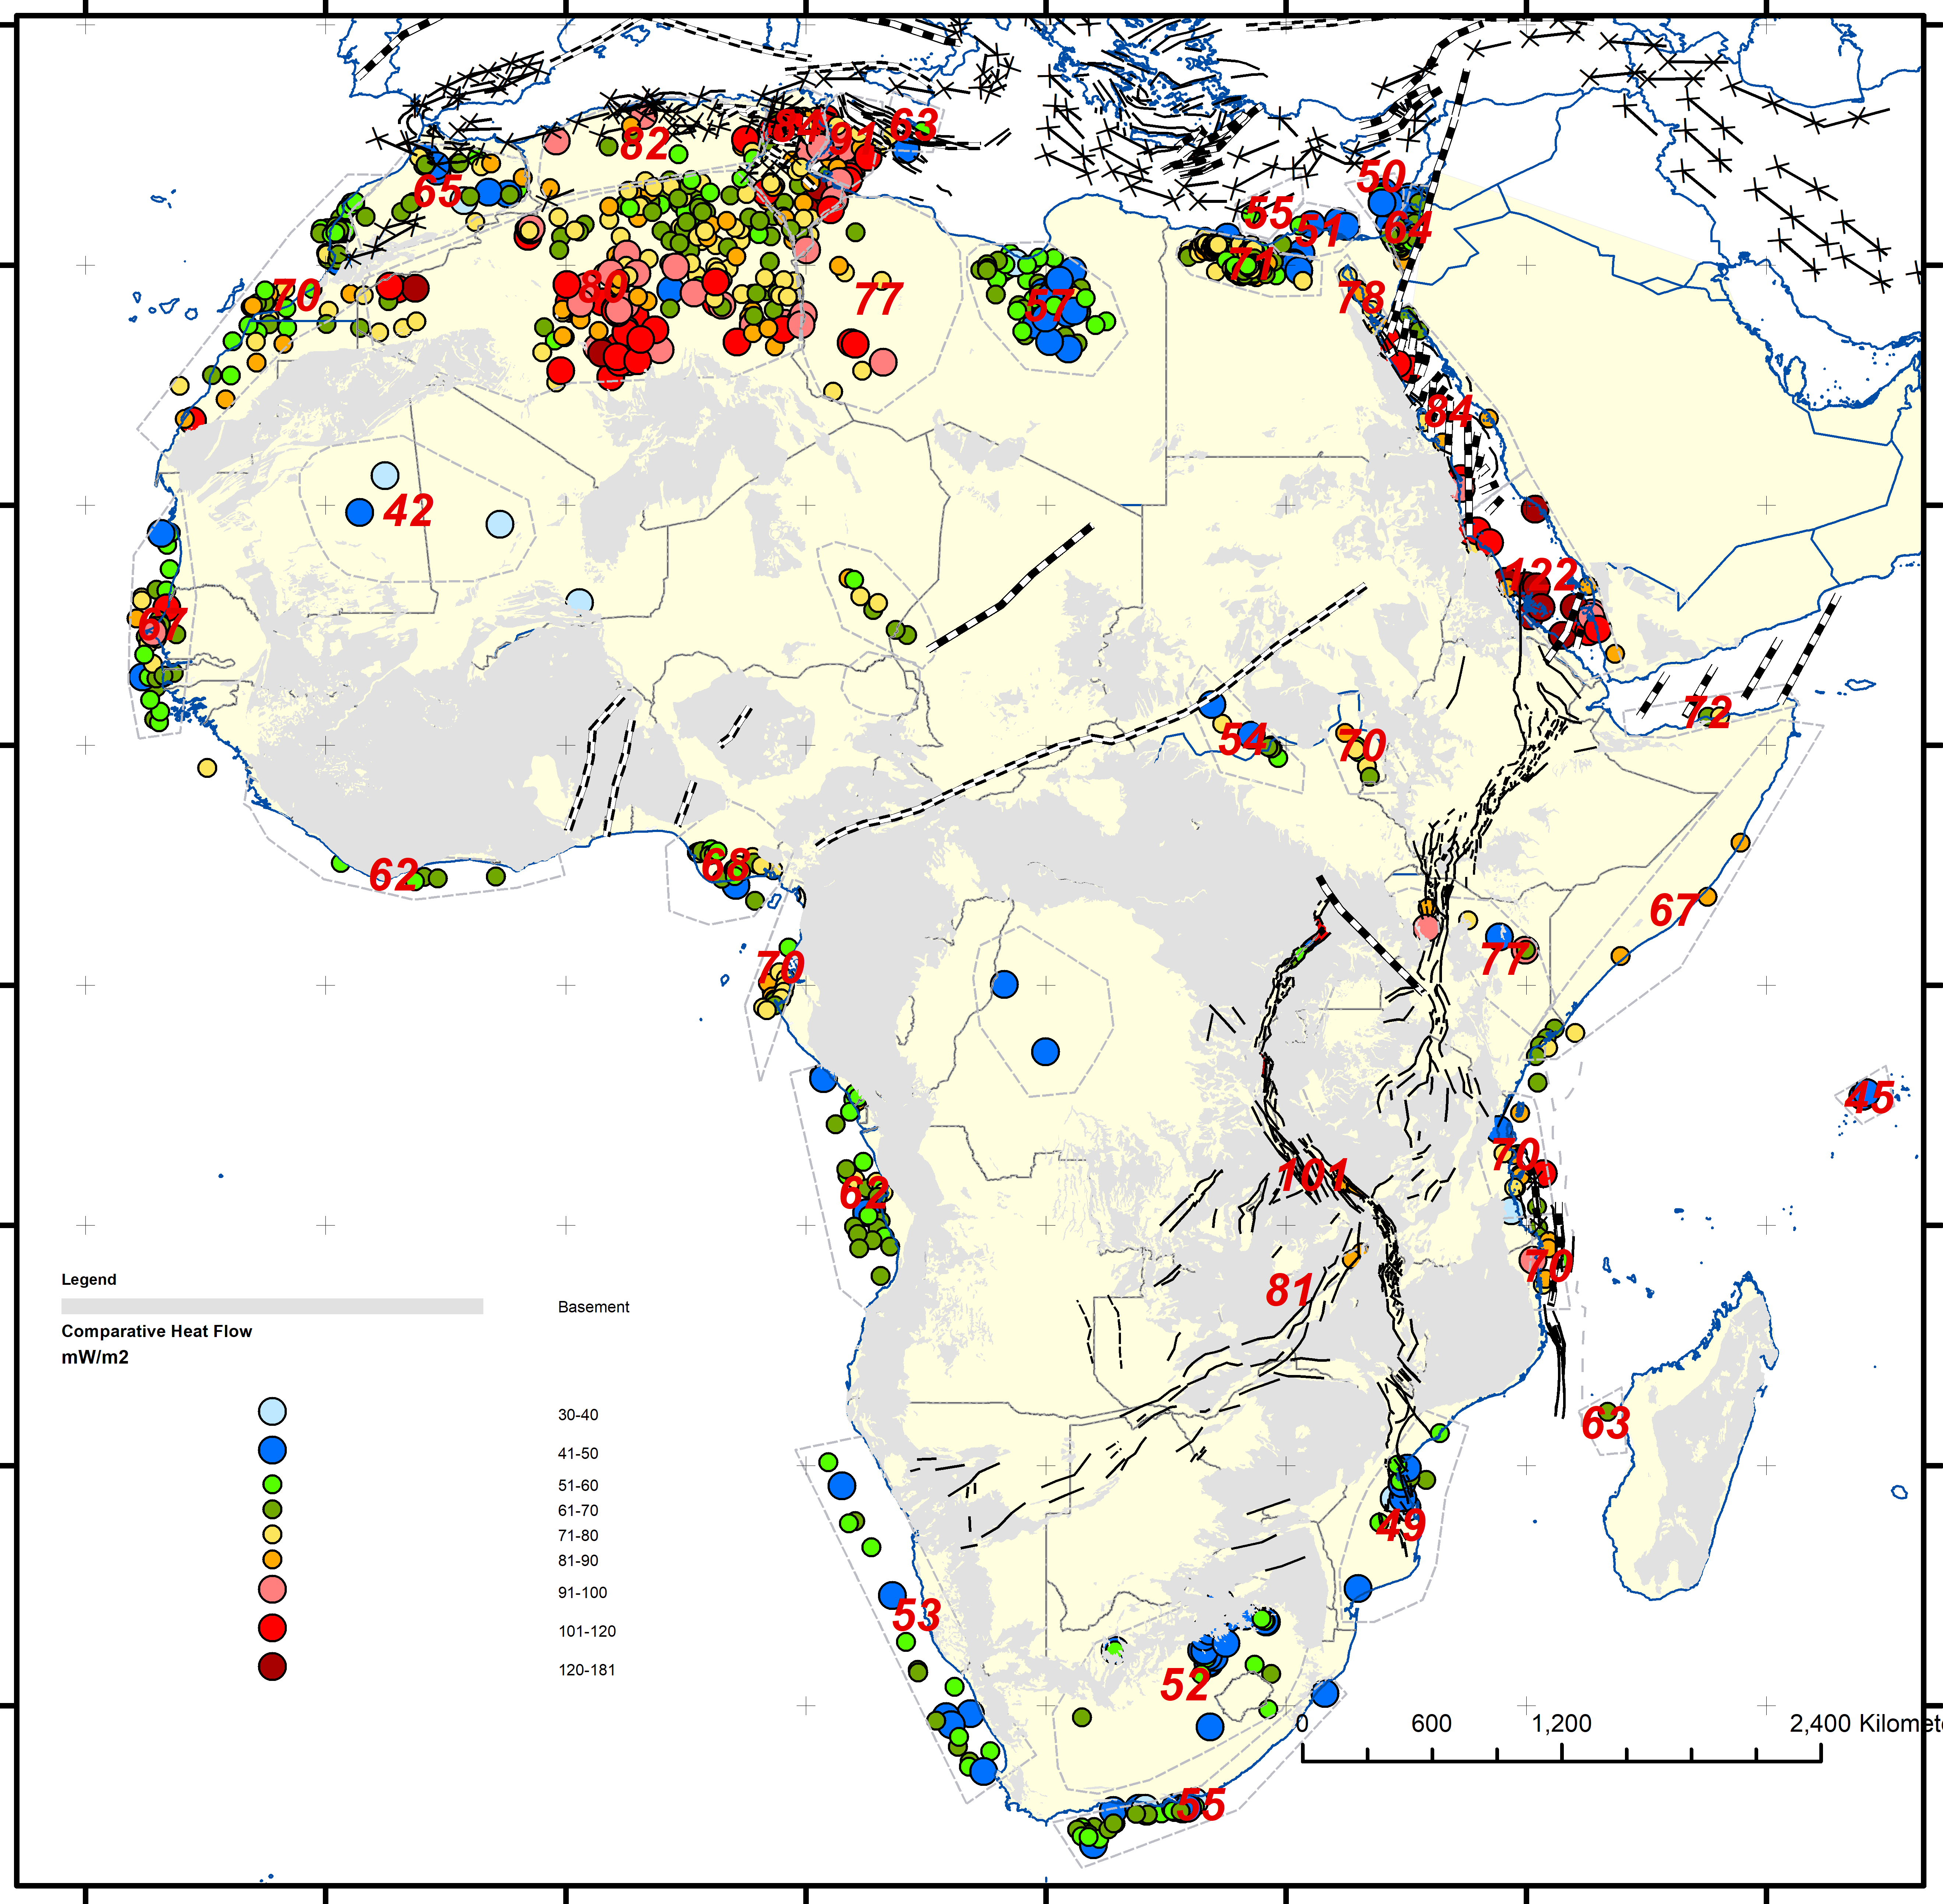
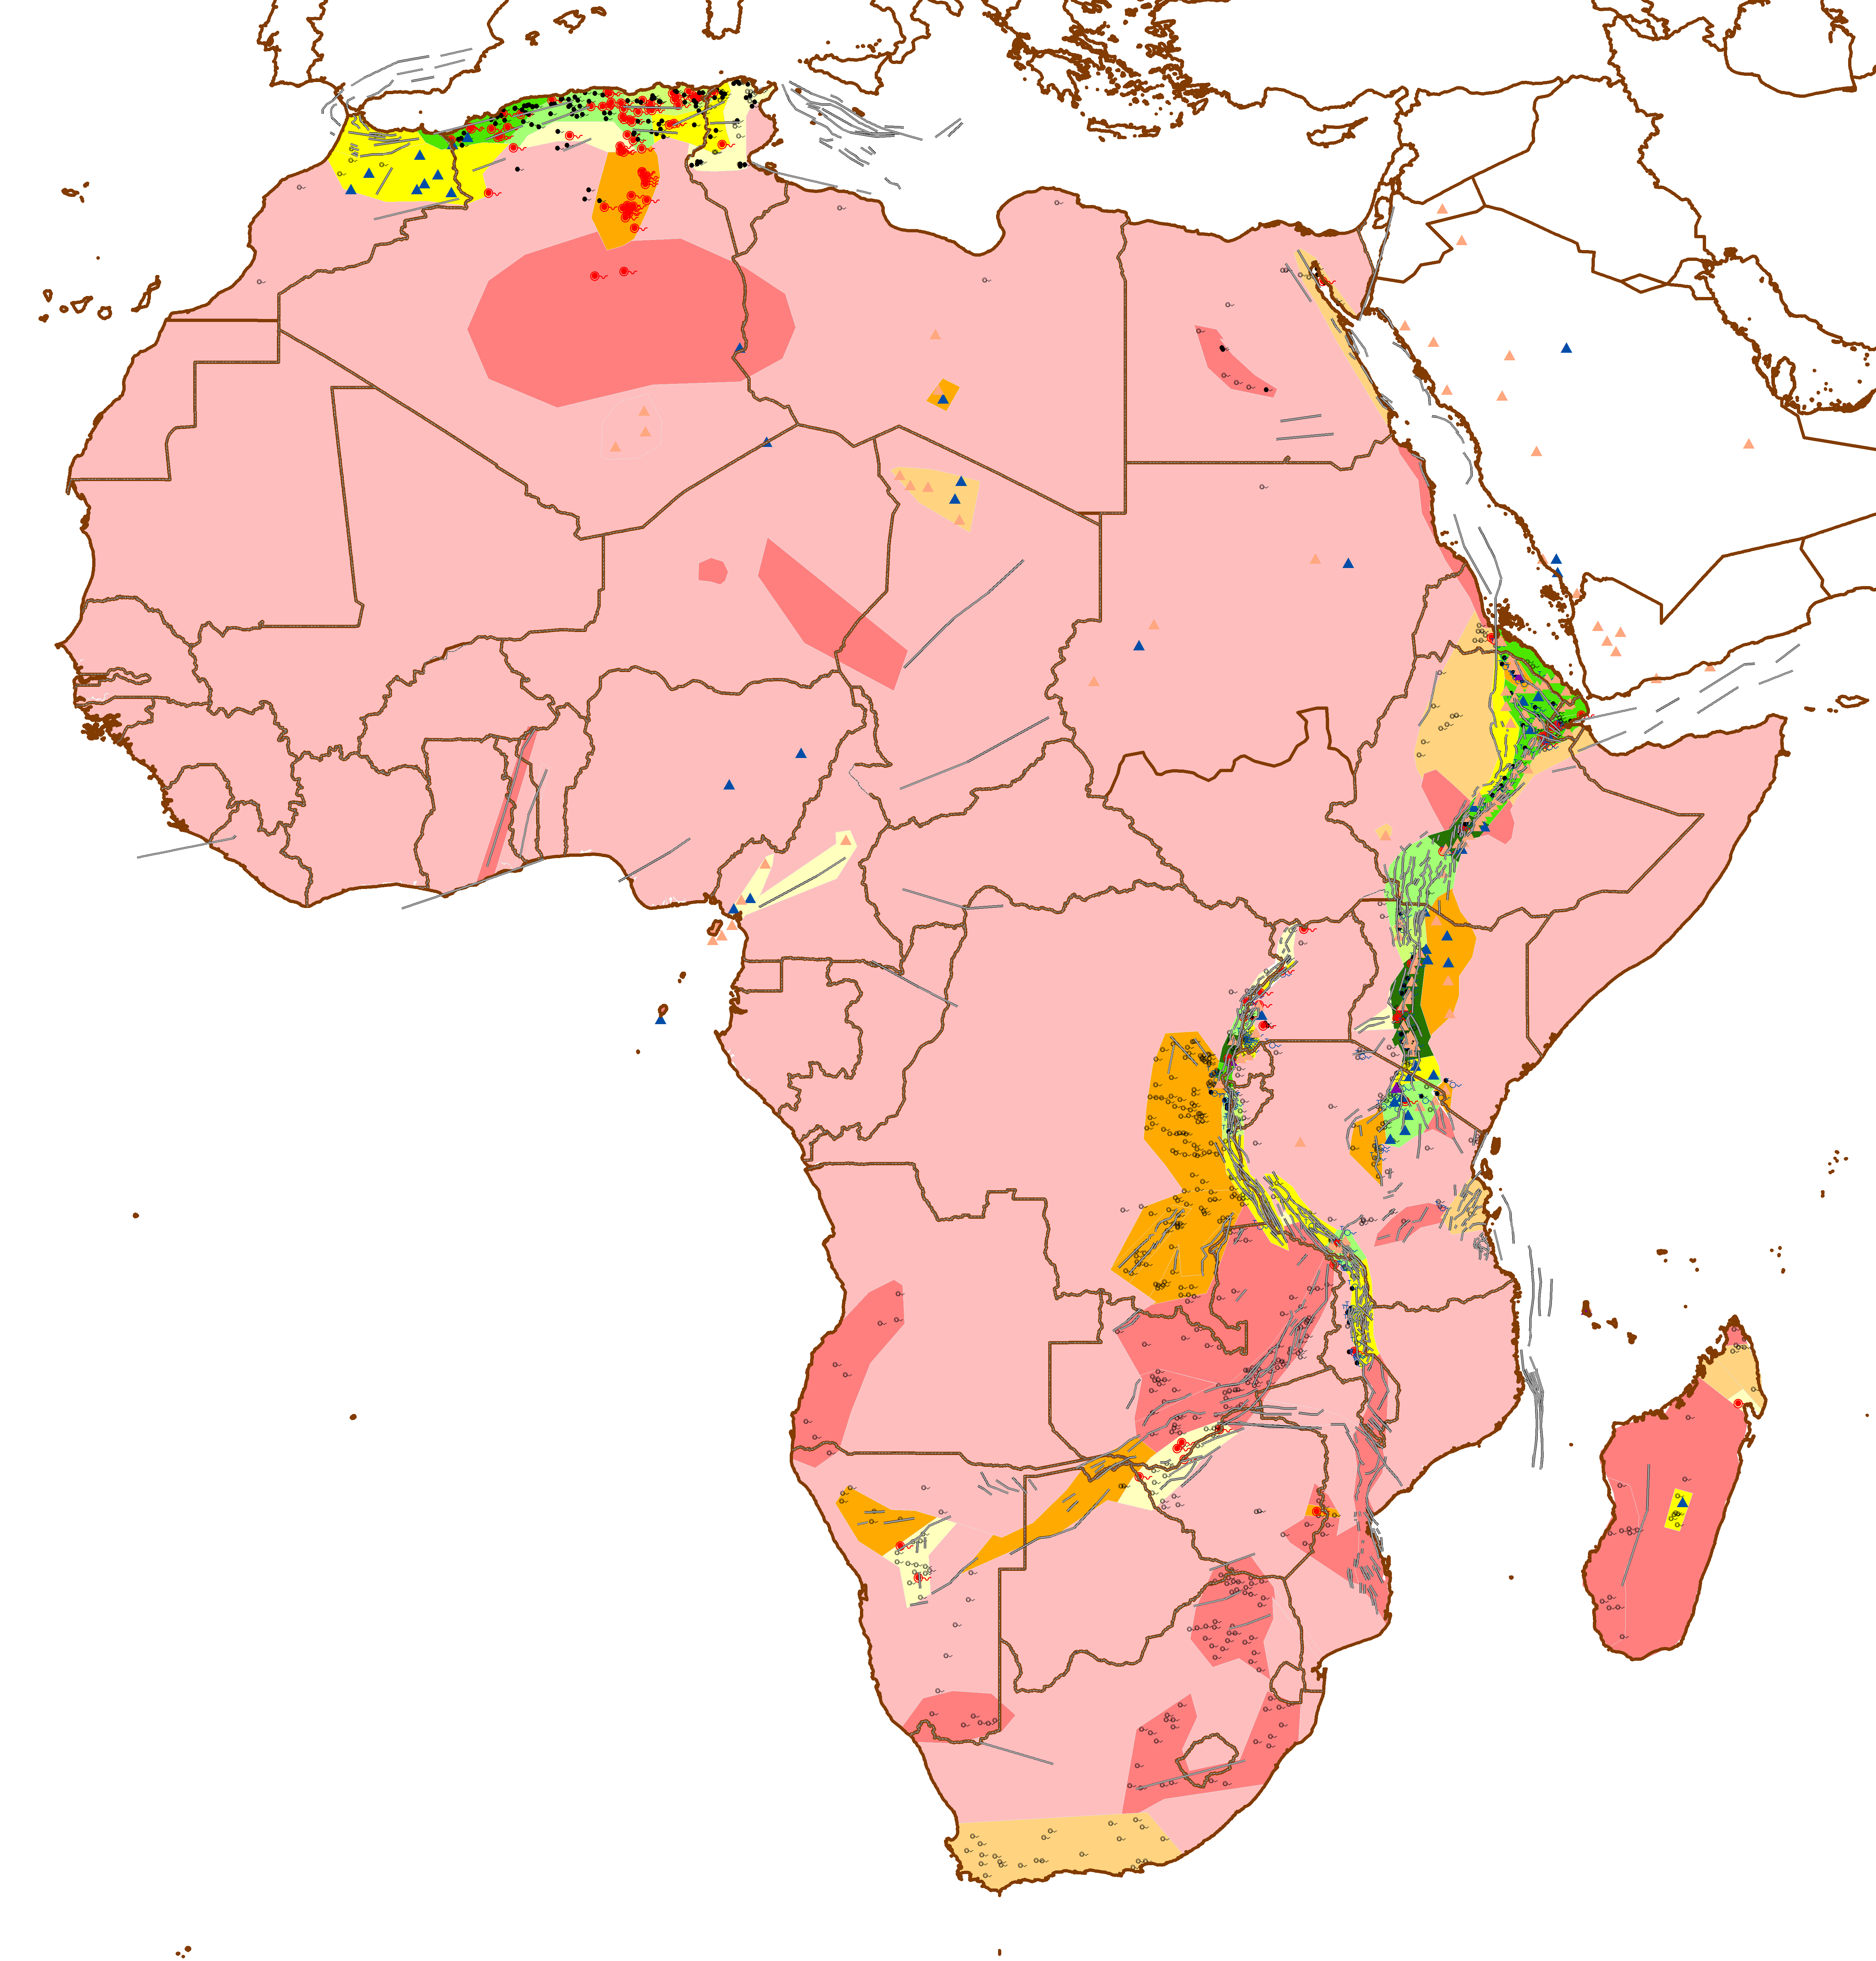
About 1750 geothermal gradient measurements from deep wells have been accessed across the African plate (first map below). Thermal conductivities based on North African studies have been used to either directly estimate heat flow from these or calibrate other authors estimates. Converting to such ‘comparative heat flow’ values reduces many of the lateral contrasts seen in geothermal gradient. The Present Day thermal regime of West Africa is shown to be consistent and featureless, with the exception of high heat flows over Senegal/Mauritania, North Gabon and the Cameroon Line. Other regions show far more variation and generally higher heat flows (second map below).
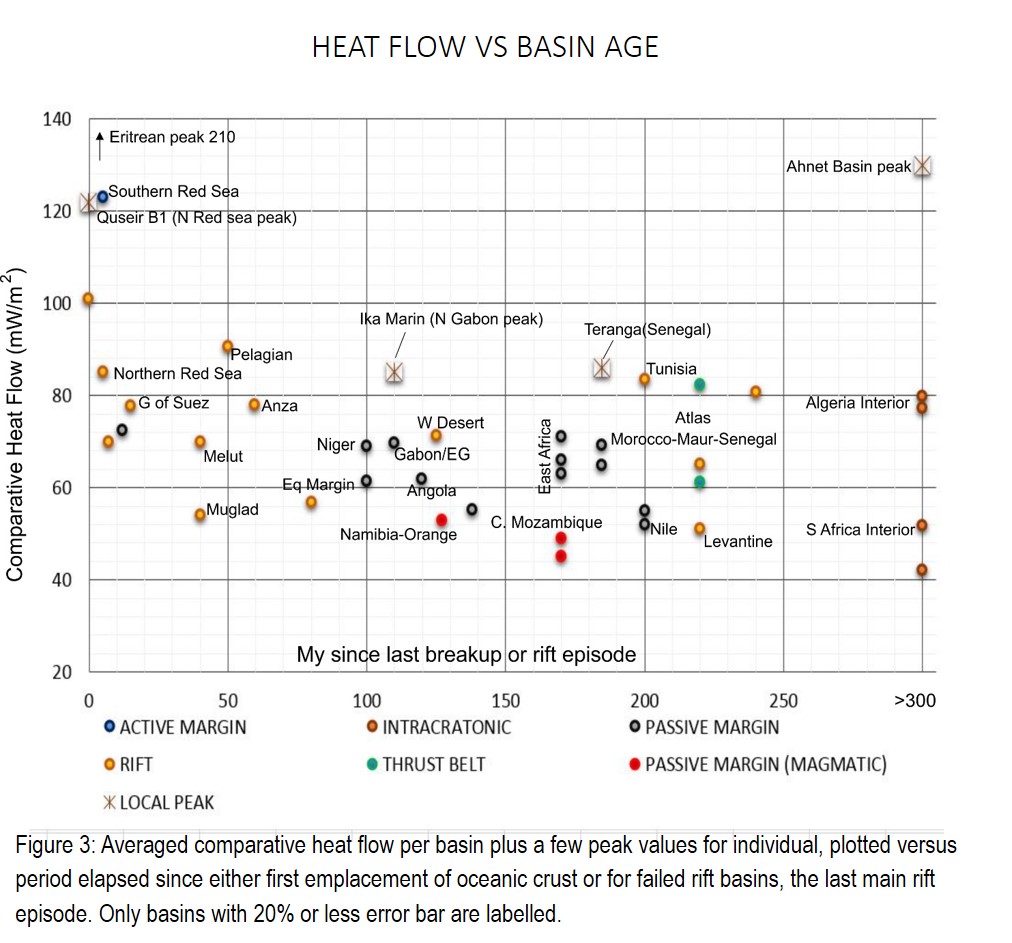
Oil and gas windows are known to vary widely in Africa, with oil generation thresholds for instance in north-east Africa varying from around 1500 m in the Eritrean Red Sea to 4500 m in the Levantine Basin. These extremes, which are consequences of the different ages of initiation of these basins, tie to extremes in the petroleum products of these two basins, which are dominated by thermogenic and biogenic gas respectively. This leads to a certain degree of predictability in Present Day heat flow, through its relationship with basin age. In some regions, however, this relationship breaks down due to an overprint of high mantle derived heat flow. This component can be less well confidently predicted through relationships with mantle seismic velocities and with mantle derived volcanism.
Modelling of the past have been a particular uncertainty in basin modelling, with often an under-appreciation of the significance of past thermal events in Africa having led to an under-prediction of the level of source rock maturity and predictions of an oil phase rather than the resulting gas. Perhaps the main application of this study will lie in calibrating the thermal history of data-poor basins, using Present Day analogues from this study for specific tectonic settingsIn order to improve the predictability of heat flow histories, both at Present Day and in the past, it is suggested that we need therefore to:
Consider the plate tectonic setting and igneous history throughout the basin’s history.
Use data on modern analogues to predict the past.
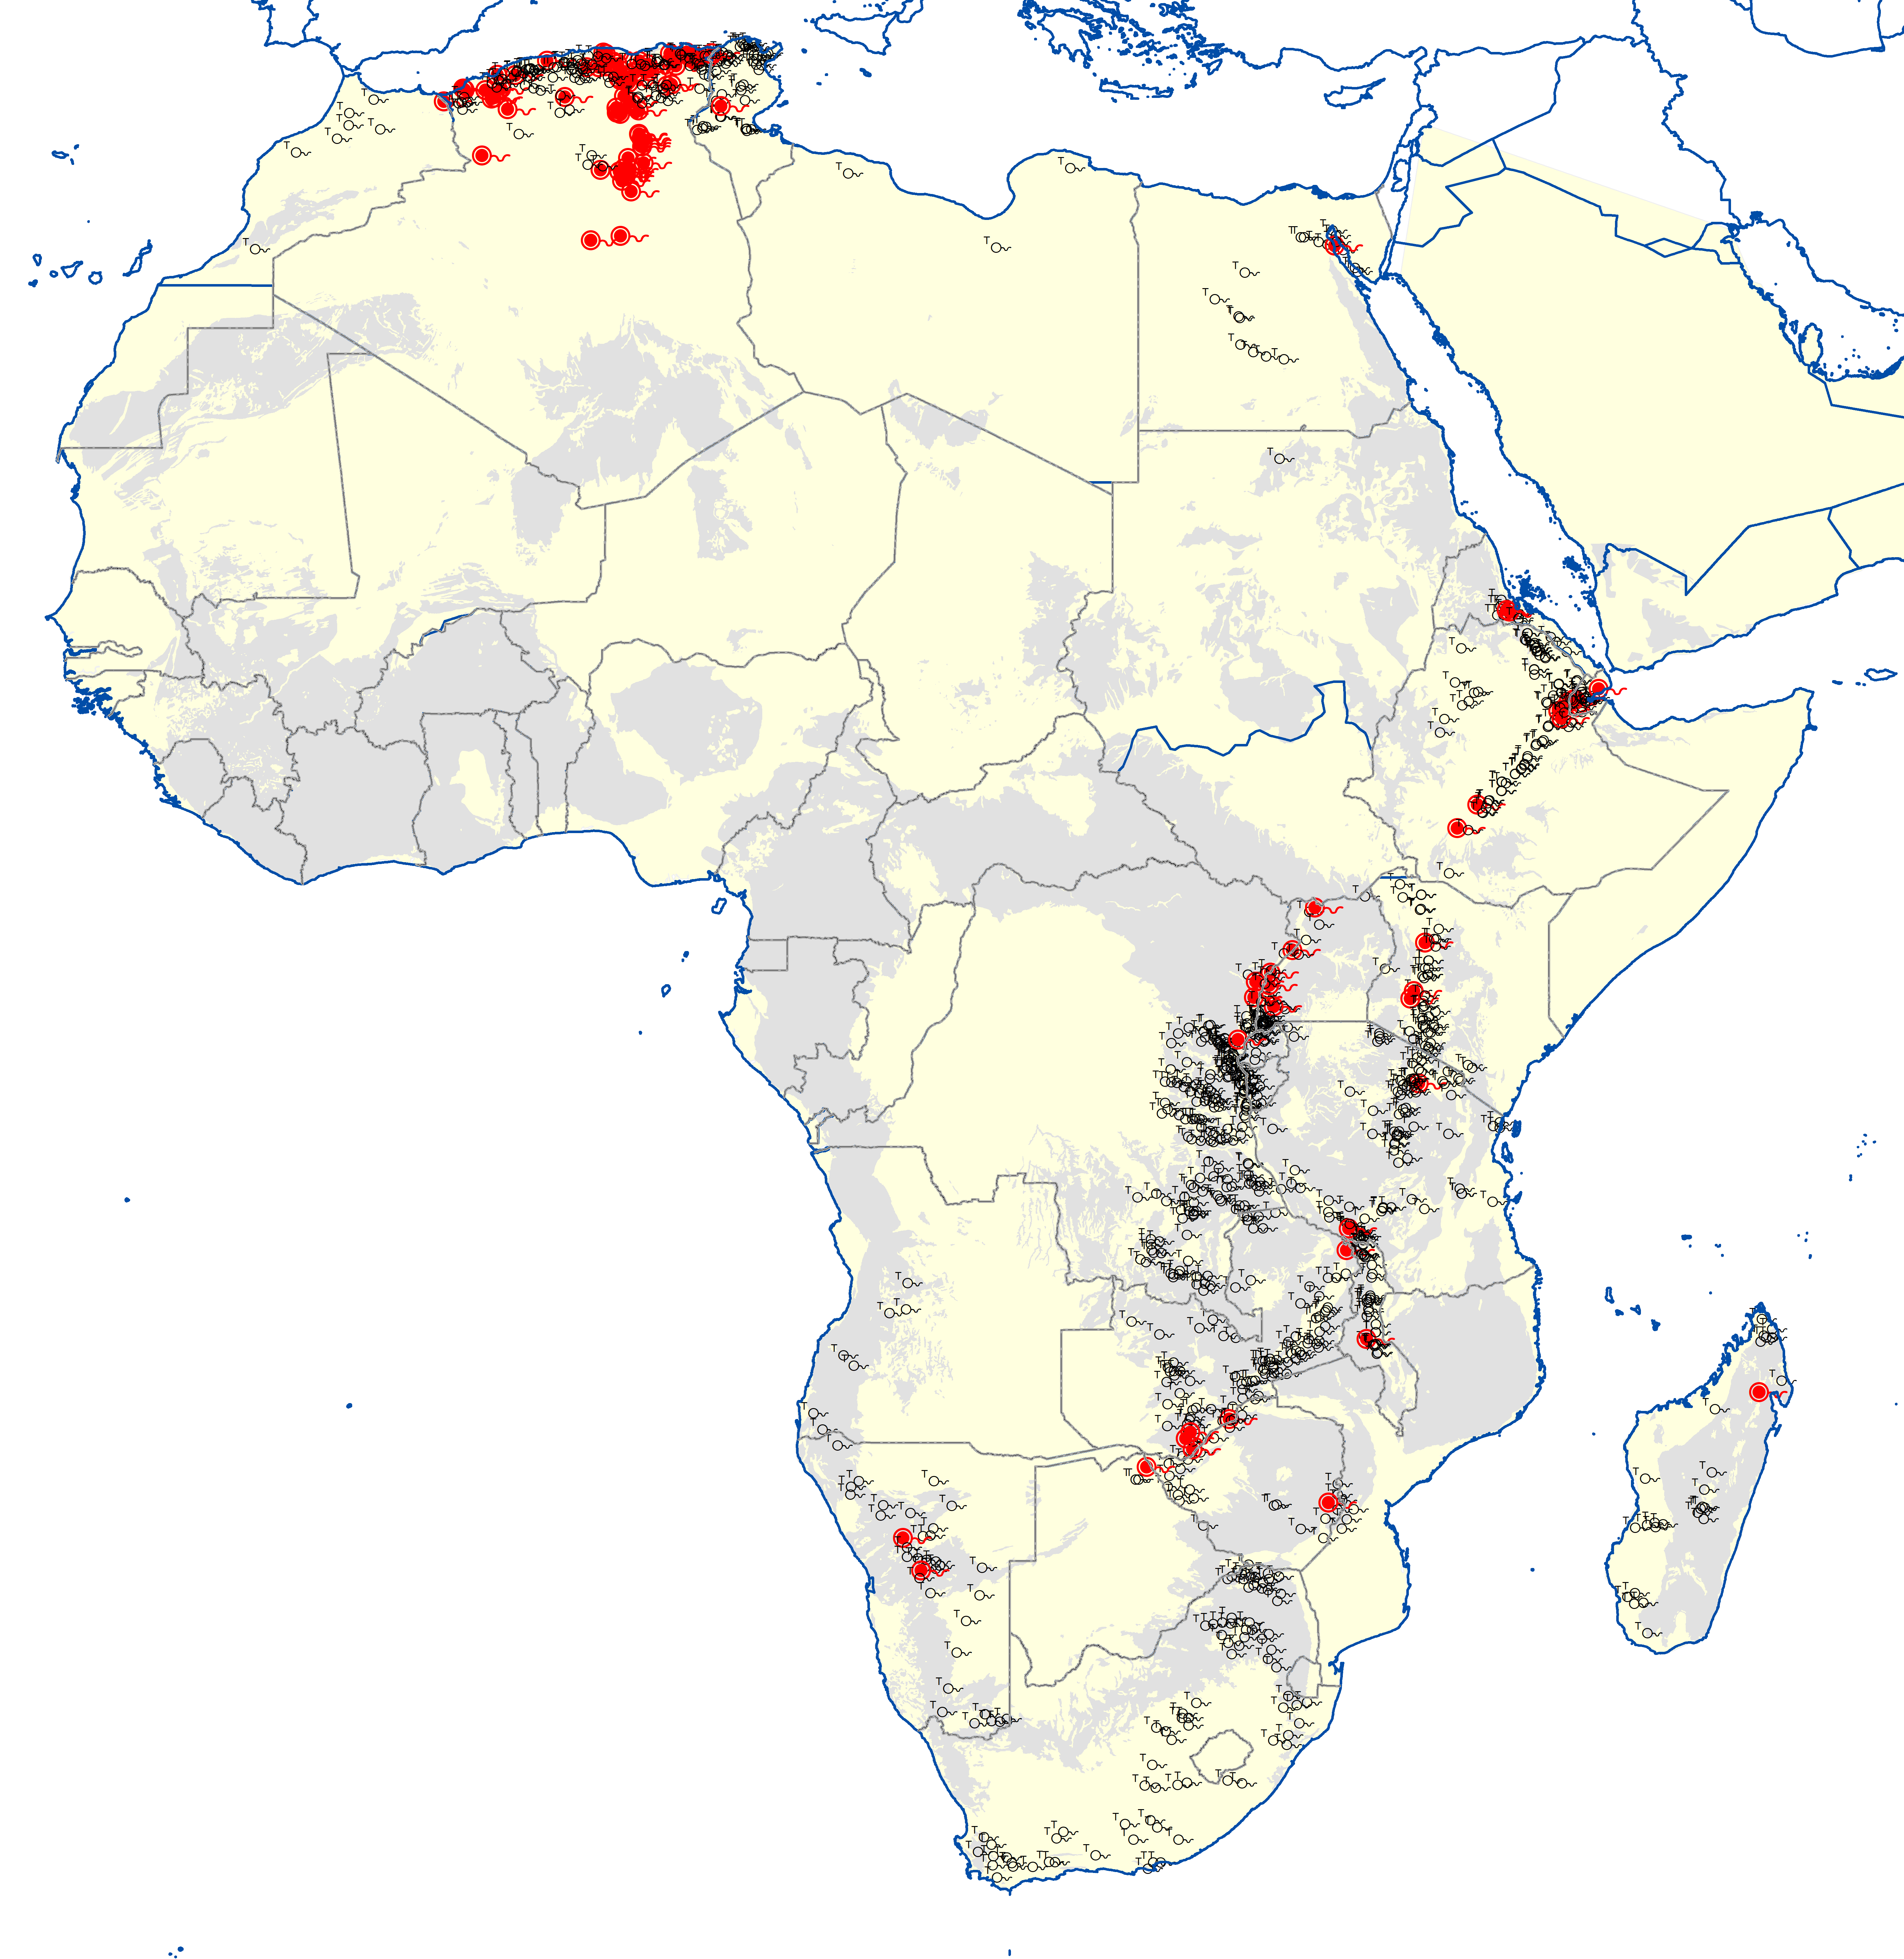
Consider the relationship to volcanics, which involves understanding the chemistry and origin of these volcanics. .
Improve our imaging of the upper mantle in order to be able to predict anomalies associated with partial melting in that zone, such as that below Algeria
Apply ranges of conceivable thermal histories, not a single model
For the full paper please go to
https://www.researchgate.net/publication/334226130...